

CLIENT
Apex Consumer Group
INDUSTRY
CPG
THE CHALLENGE
Decisions were being made on data that lived in fifteen places at once
Fragmented reporting — sales, distributor, and market data lived across 18 countries with no consistent structure
Inconsistent market coverage — regions tracked performance differently, making cross-market comparison unreliable
Limited distributor visibility — leadership couldn't see distributor health or performance at a network level
No unified product view — tracking product performance across regions required manual reconciliation

OUR APPROACH
A single pipeline feeding one self-contained platform
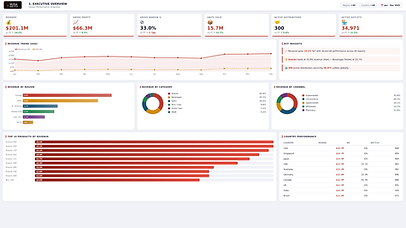
Consolidate before visualizing — bring sales, inventory, product, and store data into one centralized intelligence layer before building any reporting on top
Executive-first design — build for leadership's real-time decision-making needs, not a store-level operations tool
One platform, every metric — revenue, inventory health, product profitability, and store performance modeled together rather than as separate reports
THE PLATFORM
Five modules, one live view
Unify the data — a Python pipeline ingests and standardizes every regional feed into one clean, reconciled dataset
Model what matters — revenue, growth, market share, and distributor health modeled into clear, comparable metrics
Build it to travel — a single-file HTML dashboard with a native SVG chart engine, zero external dependencies, so it opens anywhere, online or off
Make it executive-ready — light and dark themes, five linked modules, and a layout built for boardroom screens and laptops alike

THE OUTCOME
Decision-making
Improved distributor visibility and accountability
Enhanced market coverage analysis
Better product portfolio optimization
From fragmented to unified
Single reconciled dataset — 18 countries of regional data standardized into one clean feed instead of disconnected regional sources
Five linked modules — revenue, distributor health, market coverage, product contribution, and store operations viewed together, not separately
Works anywhere
Zero external dependencies — the dashboard is a single self-contained HTML file, so it opens offline, on a laptop, or on a boardroom screen with no install
Light and dark themes — the same platform adapts to a client's preferred presentation format without rebuilding anything
WALKTHROUGH
Inside the Platform
The platform moves into distributor health, market coverage by region, and product contribution — each module built on the same standardized datasets.
TESTIMONIALS
The team truly exceeded all my expectations.
IT & Innovation Leader
British Multinational Consumer Goods Company
RUSA Analytics gave us visibility we never had before. Their demand forecasting model cut our overstock by 31% in the first quarter alone. The team is deeply embedded in retail operations — they don't just deliver dashboards, they deliver outcomes.
Head of Supply Chain Analysis
Pan-India Retail Chain
We evaluated three vendors before choosing RUSA. Their risk modeling framework was the only one that could handle our data complexity without a 12-month implementation. We were live in 8 weeks and the fraud detection accuracy exceeded our internal benchmarks.
Chief Risk Officer
Leading Private Sector Bank
MORE WORK
Explore other case studies


