
How to Connect Snowflake to Power BI Step by Step for Analytics and Reporting
Snowflake is often where trusted data lives. Power BI is often where business users expect to explore it. Connecting the two gives analytics teams a practical path from governed cloud data to interactive reports, without exporting CSV files or copying tables by hand.
This guide walks through the full process, from accessing Snowflake data to building Power BI reports that are ready for analysis.

Step by step process to connect Snowflake to Power BI
The setup happens in Power BI Desktop. The Snowflake connector is built into Power BI, so you do not need to export Snowflake data manually.
Step 1. Open Power BI Desktop and choose the Snowflake connector
Open Power BI Desktop, then select:
`Home` > `Get data` > `More`
In the connector list, search for `Snowflake`. Select Snowflake, then choose Connect.
Power BI will prompt for the Snowflake server and warehouse.
Enter the values carefully. A typo in the server's name or warehouse is one of the most common causes of connection errors.

Step 2. Enter the Snowflake server and warehouse

In the Snowflake connection window, provide:
Server
Your Snowflake account host or account identifier.
Warehouse
The warehouse Power BI should use for queries.
You may also see an option to enter a role or advanced settings, depending on the connector version and authentication method. If your default Snowflake role does not have access to reporting data, specify the correct role when available.
Step 3. Sign in to Snowflake
After entering the connection details, Power BI asks for authentication.
Choose the option that matches your Snowflake setup. This may be:
Snowflake username and password
Microsoft account or organizational SSO
OAuth-based sign-in
Other identity provider methods supported by your environment
If authentication succeeds but no tables appear, the issue is usually permission related. Confirm the selected role has access to the database, schema, and objects.
Step 4. Select databases, schemas, tables, or views

After signing in, Power BI opens the Navigator window. You can browse Snowflake databases, schemas, tables, and views.
Power BI gives two main options:
Load
Imports the selected data directly into the model.
Transform Data
Opens Power Query so you can clean, filter, shape, and rename data before loading.
For almost every real reporting project, choose Transform Data first.
Create interactive reports and visualizations
Once the model is ready, build report pages around questions users need to answer. Start with the decision, then choose visuals that support it.
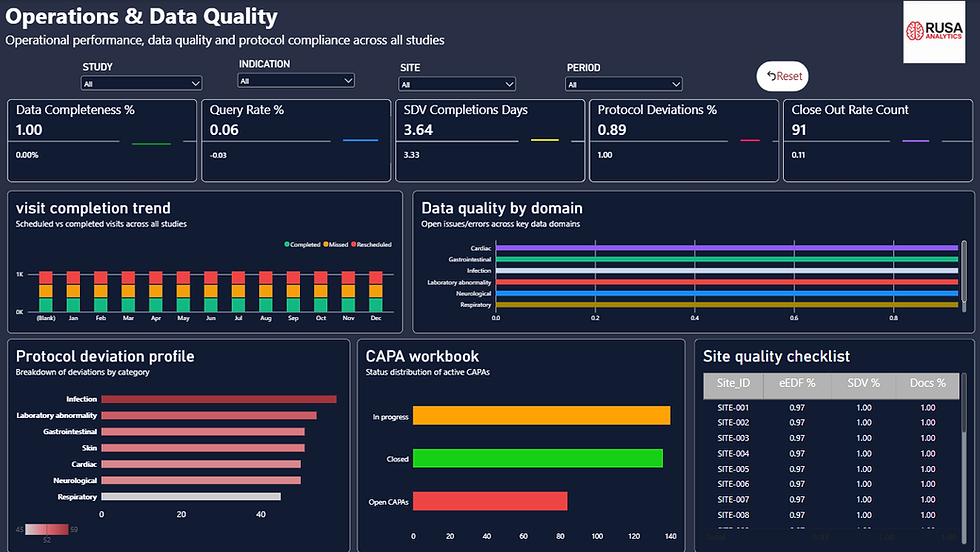
Build a clear report page
A strong Power BI report page usually has:
A small set of headline metrics
One or two trend visuals
A breakdown by category
Slicers for common filters
A table or matrix for detail when needed
Keep each page focused. If one page tries to answer every question, users spend more time searching than analysing.
Add slicers and cross-filtering
Power BI becomes interactive when visuals filter each other. A user can click a product category and see the trend chart, cards, and table update instantly.
Useful interactive features include:
Slicers for date, geography, category, or segment
Drill-down for hierarchies such as year, quarter, month
Drill-through pages for customer, product, or transaction detail
Tooltips that show supporting metrics
Bookmarks for guided views
Buttons for page navigation
Use these features with restraint. Interaction should make the report easier to explore, not harder to understand.

Final takeaway
Connecting Snowflake to Power BI is more than a connector setup. The best results come from three linked decisions: use the right Snowflake role and warehouse, prepare a clean Power BI model, and design reports around focused analysis.
Start with curated Snowflake tables or views. Choose Import or Direct Query based on data size, freshness, and performance needs. Use Power Query and the model view to shape a clear dataset. Then build report pages with slicers, drill-through paths, and visuals that answer real business questions.
When the connection, model, and report design work together, Snowflake becomes a reliable source for Power BI analytics, and users get reports they can explore with confidence.


Comments