
What Is Copilot in Power BI? A Practical Introduction to Al-Powered Analytics

Your AI assistant for smarter data insights
Business intelligence has traditionally required users to work with dashboards, filters, charts, measures, and queries to find useful information from their data. Copilot in Power BI adds an Al-assisted way of interacting with reports and data by allowing users to describe what they need using natural language.
Instead of manually navigating through every visual or starting a calculation from scratch, users can ask questions, request summaries, explore report content, and get assistance with certain Power BI development tasks.

For organizations already using Power Bl, Copilot can become another layer of interaction between users and their business data. However, its usefulness depends on the quality of the underlying data model, the clarity of the user's request, and human validation of the generated results. Copilot in Power BI adds an AI-assisted way of interacting with reports and data by allowing users to describe what they need using natural language. For RUSA Analytics, this highlights how AI can make modern data analysis more accessible and efficient. Instead of manually searching through reports or writing every calculation from scratch, users can ask questions and receive Al-generated insights, summaries, and assistance with report development.
What Is Copilot in Power BI?
Copilot in Power BI is an Al capability designed to assist users with data analysis, report development, and understanding Power BI content.
It allows users to interact with their Power BI environment using natural-language prompts instead of relying entirely on traditional report navigation or manually written queries.
For businesses such as RUSA Analytics, AI-assisted analytics can provide a practical way to help users work more efficiently with business intelligence.
For example, rather than manually examining several sales visuals, a user could ask a question such as:
"What were the main changes in sales performance this year?"
Copilot can use the available report and semantic-model context to help generate a response or summary.
The goal is not simply to automate reporting. It is to make data interaction more conversational and reduce some of the repetitive work involved in analyzing and presenting information.
Why Is Copilot Relevant to Power BI?
Modern organizations often collect large amounts of information from sales, finance, marketing, operations, customer service, and other business functions.
The challenge is not always collecting the data. The bigger challenge is turning that data into information that people can understand and act on.
A traditional dashboard might contain:
Revenue
Sales volume
Customer information
Product performance
Regional performance
Monthly trends
Key performance indicators (KPIs)
A business user may still need to manually filter these visuals and interpret the results.
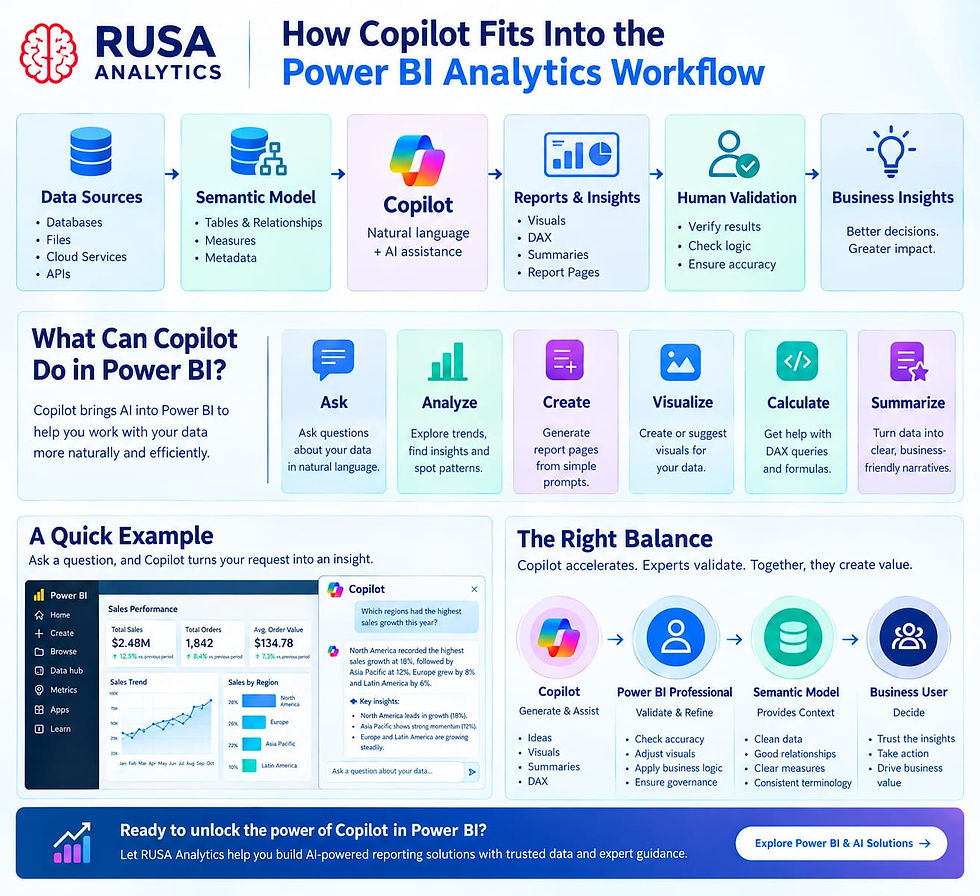
Copilot introduces a more natural way to explore this information. This AI-driven approach can help organizations make their existing Power BI reports easier to explore and understand.
How Does Copilot Work with Power BI?
At a high level, Copilot works with the information available within the Power BI report and its underlying semantic model.
A semantic model is the structured representation of data used by a Power BI report. It defines tables, relationships, columns, measures, and other elements that help Power BI understand the business data.
The quality of this model is important.
For example, imagine a company has a sales model containing:
Sales → Products → Customers → Regions → Dates
with measures such as:
Total Sales
Total Profit
Sales Growth
Average Order Value
A user can then ask questions related to those business concepts.
This means that preparing the data model correctly remains an important part of a successful Power BI implementation. For RUSA Analytics, combining a reliable Power BI data foundation with AI capabilities can help create analytics solutions that are both practical and easier for users to interact with.
What Can Copilot Help With?
Copilot can support several areas of Power BI.
1. Understand Existing Reports
Large Power BI reports can contain many pages and visuals. Understanding what a report is communicating can take time, especially for users who did not build it themselves.
Copilot can help summarize report content and provide a starting point for understanding the information presented. The following capabilities show how AI in Power BI can support different stages of data analysis and report development.
For example:
“Summarize the key information on this report page.”
This can be useful when preparing for a meeting or quickly reviewing an existing dashboard.
2. Ask Questions About Data
One of the most useful aspects of an AI assistant is the ability to ask questions in natural language.
For example:
“Which product generated the highest revenue?”
or:
“Which region had the strongest sales performance?”
Instead of manually navigating through multiple visuals, the user can start with a question and use the response to guide further analysis.
The exact usefulness of the response depends on the data available to the report and how well the semantic model represents the business requirements.
3. Generate Summaries and Narratives
Business reports often need more than charts.
Stakeholders may also want a short explanation of what the numbers mean.
Copilot can assist in generating narrative summaries that describe information available in a report.
For example, a sales report may contain a monthly trend showing an increase in revenue during the final quarter.
A narrative can help communicate that trend in a more readable format for business users.
This can be particularly useful when reports are shared with managers or stakeholders who want the main takeaway without studying every visual.
4. Assist with Report Creation
Creating a Power BI report involves deciding:
Which data should be displayed
Which visuals are appropriate
Which fields should be used
How information should be organized
What questions the report should answer
Copilot can help users get started with report-page creation based on a description of what they want to analyze.
For example:
“Create a report page for analyzing regional sales performance.”
This can provide a starting point for the report.
The developer or analyst can then review the generated content and make changes according to the organization's requirements.
5. Help with DAX
DAX (Data Analysis Expressions) is the formula language used in Power BI for creating calculations and measures.
Writing DAX can be challenging for beginners, particularly when calculations involve filters, time intelligence, relationships, or multiple conditions.
Copilot can assist with generating DAX based on a natural-language description.
For example, a user might describe a requirement such as:
“Calculate sales for the current year.”
Copilot can help generate a starting calculation that the developer can review and modify.
This can reduce the time spent creating certain calculations, but generated DAX should always be checked before being used in an important report.
Benefits of Copilot in Power BI
When implemented appropriately, AI-powered Copilot can provide several practical benefits for Power BI users and analytics teams.
Faster exploration
Users can begin with a natural-language question instead of manually exploring every visual.
Easier access to insights
Business users can interact with reports using terminology that is closer to everyday business communication.
Support for report development
Developers can use Copilot as an assistant when creating certain report content and calculations.
Reduced repetitive work
Tasks such as summarizing information or generating initial content can take less manual effort.
Improved communication
Narrative summaries can make complex report information easier to communicate to stakeholders. RUSA Analytics can explore how AI-assisted Power BI capabilities can be incorporated into modern analytics workflows, while keeping data quality, business requirements, and human validation at the center of the process.


Comments